 Ride CT & Ride New England Serving New England, NYC and The Hudson Valley!


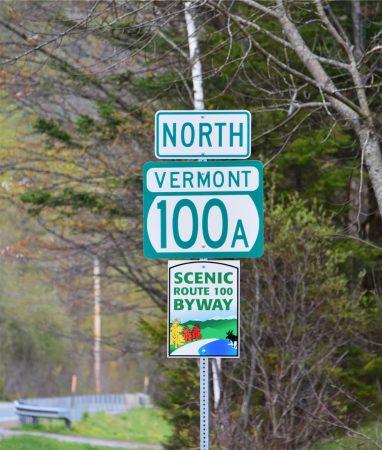
As riders, we gripe about distracted drivers who are too busy texting, phoning home or putting on makeup to notice us, but a new  study reveals that some of the best drivers in the U.S. are found in New England. In fact, Vermont was second best, topped by only Minnesota, as the safest place to be on the highway.
Two other New England states – Rhode Island and Massachusetts – finished in the “10 best” for drivers. The only New England state that did poorly was Connecticut.
The study by CarInsuranceComparison.com, a website that allows consumers to compare insurance companies, actually ranked states (and the District of Columbia) from worst to best by analyzing statistics from five categories provided by the National Highway Transportation Safety Administration. The worst was listed as No. 1 as opposed to (more logically) being shown in last place.
Therefore, tying for first place for having the worst drivers were Texas and Louisiana. South Carolina came next in third place, followed by North Dakota, Delaware, New Mexico, Nevada, Alabama and Arizona (which tied for eighth place) and Montana.
 While Minnesota had the best drivers and ranked at the bottom of the list in 51st place, Vermont came in 50th place, with Rhode Island in 47th place, Massachusetts in 46th place and Maine in 40th place.
New Hampshire finished 35th, New York finished 30th, while Connecticut captured the 15th spot thanks to a drunk driving fatality rate that placed it second worst nationally. The only state with a higher percentage of fatal crashes involving alcohol was North Dakota.
The study, released Wednesday, revealed that Vermont drivers were tops in obeying traffic signals, wearing seat belts and having valid drivers licenses. The state was also in the runner-up spot for having fewest fatalities per 100-million vehicle miles traveled, behind Massachusetts which had the lowest fatality rate.
New Hampshire, meanwhile, had the second most cases of fatalities when speeding was the cause. Only the District of Columbia was worse.
To get the final rankings, CarInsuranceComparison.com used NHTSA statistics from five categories:
- Fatalities per 100 million vehicle miles traveled.
- Failure to Obey (percentage of fatal crashes that involved traffic signals, not wearing seat belts and driving with an invalid driver’s license).
- Drunk Driving (percentage of fatal crashes that involved alcohol).
- Speeding (percentage of driving fatalities that were speed-releated).
- Careless Driving (pedestrian and bicycle fatalities per 100,000 population).
For an interactive map showing stats for individual states, visit here.